Business Intelligence

Take control of your company’s data

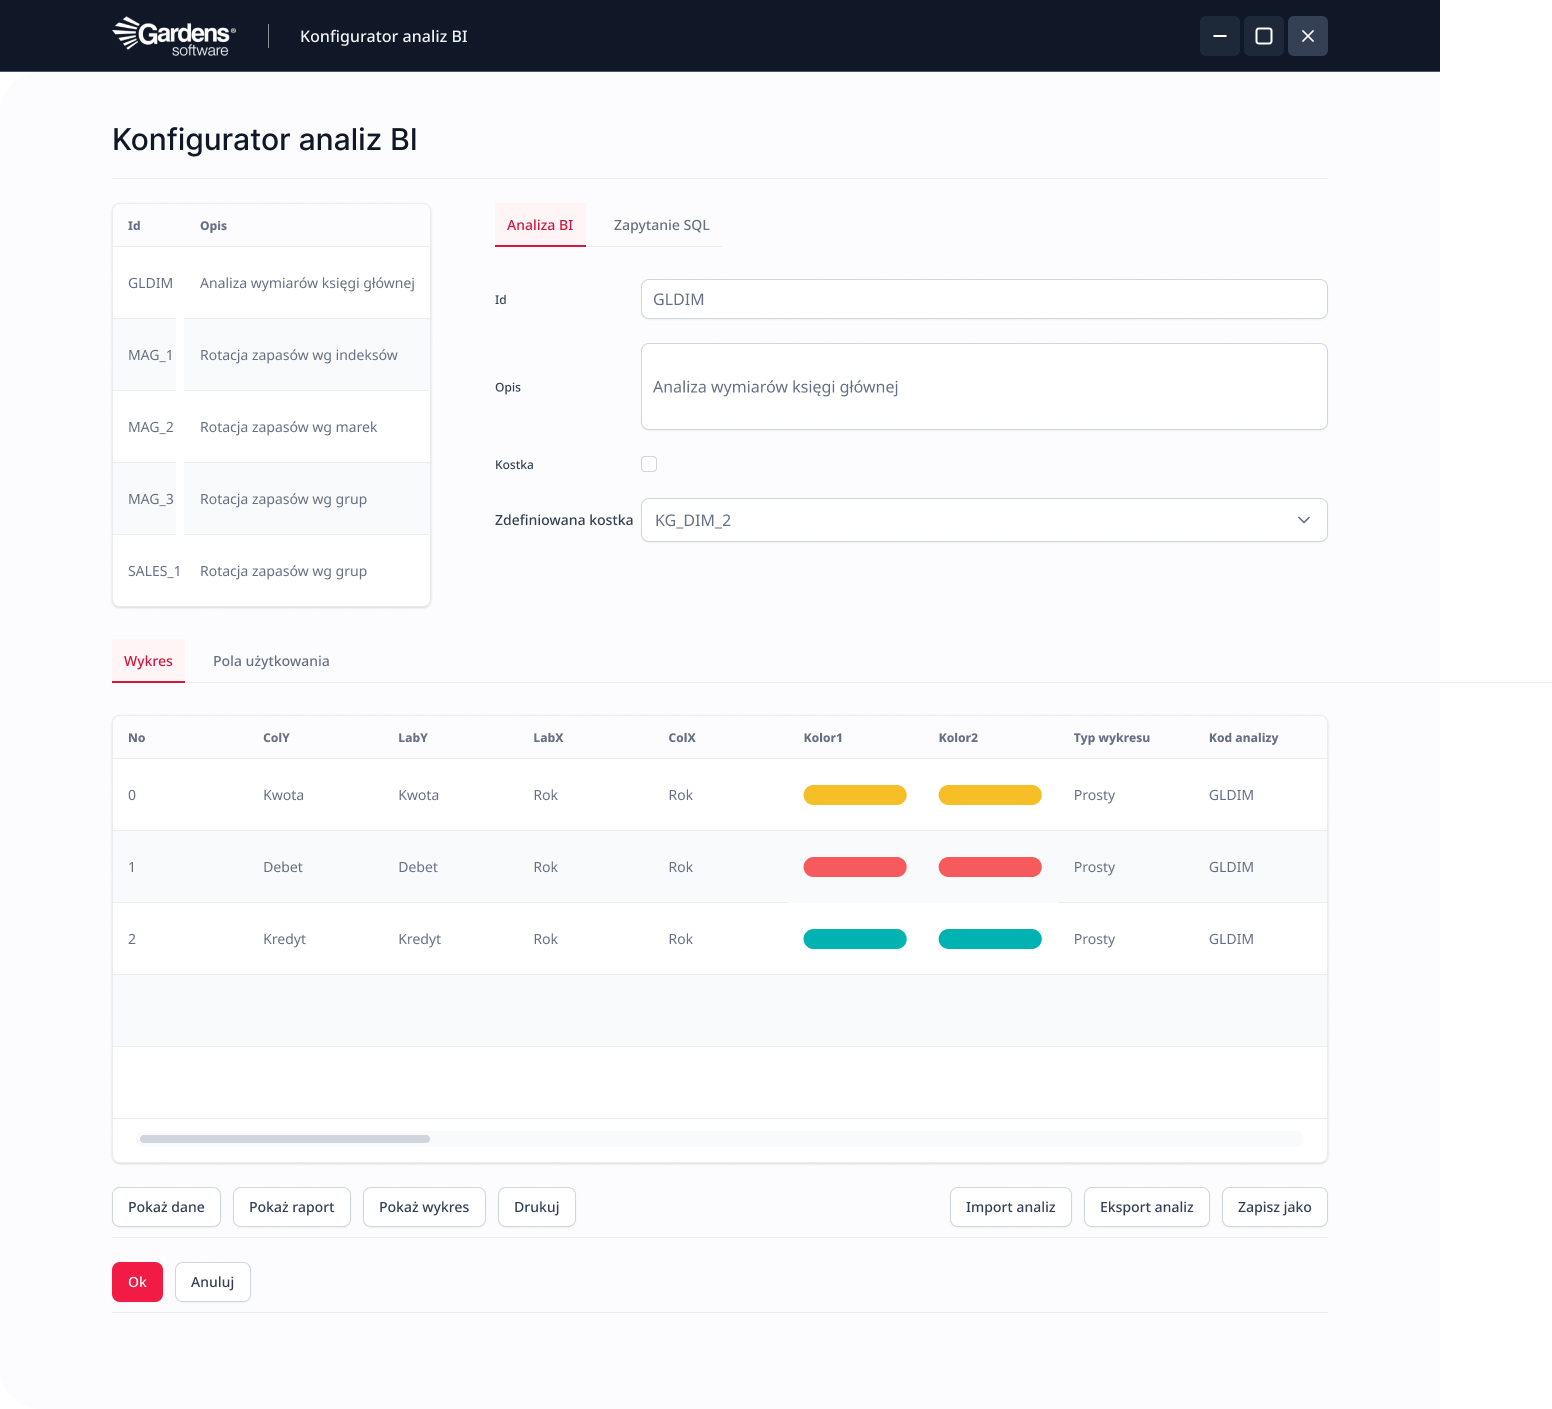
Streamline data analysis, gain valuable business insights, and make informed decisions. Our module gives you the tools to define charts, create various reports, and interpret the business logic at work in your company. Gain easy access to key data that you can effectively use to grow your business.

Home page
»
Gardens ERP
»
Business Intelligence

The Business Intelligence module is a tool that enables analysis and interpretation, supporting the making of effective business decisions.

The system allows for the definition of various charts and data compilations, giving users unlimited possibility to independently generate interesting analyses. The BI module is intended to support users in analyzing data and drawing valuable conclusions from it, both at the management and operational levels.

Benefits

  • Easy generation of reports: Users can quickly and independently create data reports that interest them, without the need to involve programmers.
  • Analysis of data from any table: The module enables the generation of analyses from any table in the ERP system, which gives users broad possibilities for analyzing various areas of activity.
  • Support for various users: The system is attractive both for conscious users with an analytical background and for developers who can efficiently prepare reports for clients.
  • Rapid analysis prototyping: Users can quickly generate analysis prototypes for presentation needs, on a small data subset, and if the data proves valuable, it can be packaged into the target user interface.
We offer comprehensive support at every stage – from needs analysis, through implementation and training, to post-implementation service. Integrate our system with the remaining ERP modules in your company and gain full control over the processes. Contact us to learn more and optimize BI management in your company.

Business results

Flexibility

The BI module allows for data analysis from various perspectives and customizing reports to the individual needs of users.

Effectiveness

Independent report generation by users shortens the time needed to obtain required information.

Versatility

The module can be used for data analysis from various areas of the enterprise's operations.

Simplicity of use

Generating analysis can be simple and intuitive, available with a few clicks.

Analysis configuration tool dedicated to system administrators

System administrators gain a powerful tool for independent definition and customization of analyses, which allows for precise adjustment of reports to the specific needs of the company and users, without the need to involve programmers.
Nowoczesne podejście do zarządzania bazą danych firmy, z zarządzaniem osobami i firmami:
  • Independent definition of analyses by trained users using a dedicated configurator and defining SQL queries
  • "Drag and drop" function enabling the addition or removal of elements (fields) to charts/graphs and multilevel graphical analysis
  • Access to source data directly from the analysis chart – from general to detailed
  • "Connection" function enabling the compilation of data from the system with data originating externally

Available BI analysis packages

Users receive ready-made analysis packages that allow for quick access to key business information, which speeds up the decision-making process and increases operational effectiveness.
Wspólny system dla twojego przedsiębiorstwa do zarządzania terminarzem, planowania spotkań i nie tylko.
  • Sales results measurement
  • Revenue and transaction forecasting
  • Inventory turnover tracking
  • Dedicated panels for managers
Gardens ERP
Software tailored to the needs of your business.
Analysis configuration tool dedicated to system administrators
Independent definition of analysis using a dedicated configurator by trained users on the client side, independent definition of SQL queries
Independent definition of OLAP data cubes
Management, modification, and optimization of existing analyses
"Drag and drop" function enabling the addition or removal of elements (fields) to charts/graphs and multilevel graphical analysis
Access to source data directly from the analysis chart (from general to detailed)
Ability to apply thresholds to charts – easier analysis of a business case, e.g., satisfactory availability threshold for a given item, sales execution threshold set for sales representatives, etc
Ability to change the effect of presented data – applying appropriate colors to the chart, selecting the chart type, changing the background, scale, removing unnecessary fields or adding others to the analysis
Ability to apply filters in analyses
Ability to save the analysis or export it as a pdf file, e.g.
"Connection" function enabling the compilation of data from the system with data originating externally
Available BI analysis packages
Sales analysis by months (sales, sales costs, and profit generated broken down by month)
Sales analysis by brand data
Sales analysis by warehouse indices
Sales analysis by warehouses
Sales analysis by buyers
Sales analysis by sales representatives (sales, sales costs, and profit generated broken down by sales representatives)
Sales representatives' share in sales
Report of margin for individual sales representatives in given months
Report of sales dynamics for a given brand year-on-year
Report of sales and margin plan execution in given months
Summary report of total margin dynamics and net sales for all clients assigned to a given sales representative over given time periods
Percentage share of sales representatives in sales
Report of the percentage of discounts issued by sales representatives in all months of the year
Report of budget execution by sales representatives in a given time period, it is also possible to select the budget execution of a specific sales representative in months
Overdue receivables for a sales representative
Overdue receivables for a buyer in a given period
Quantity and value status of selected warehouses
Inventory turnover by indices – an indicator showing the best-rotating indices
Inventory turnover by brands – an indicator showing the best-rotating brands
Quantity or value share of given brands in the warehouse
Aging of goods in the warehouse – an analysis showing the oldest deliveries in a given warehouse according to a given time period or selection of a given index. Selecting the appropriate brand shows a detailed analysis of the oldest deliveries of a given brand index
Report of purchases by suppliers
Creation of dedicated panels for managers of given sections of the enterprise – one for the sales manager, another for the warehouse manager
Ability to archive previous analyses, which allows for effective comparison with current ones

Business Intelligence analysis, an aid to planning

The Business Intelligence analysis system provides access to a lot of information that is necessary for planning subsequent logistical steps undertaken in the company's operational process. Thanks to it, it becomes possible to assess previous achievements and identify areas requiring improvement. Our system allows for the analysis of data uploaded to the system in connection with current operations of the enterprise, as well as those originating from outside. In this way, you can compare ready-made analyses and track progress.

The Business Intelligence system also allows for forecasting profits and planning transactions in the coming months based on historical data and additional information provided by the user. In this way, you can determine, among other things, when the company will be able to afford the next investment, pay off liabilities, or realize planned goals. Based on this, it is also possible to optimize activities so that profits are even greater, or to create an appropriate strategy.

The software also allows for the collection of data from individual branches of the enterprise on the territory of Poland or other countries. The data can be compared separately for each facility or as a whole for the organization.

ERP analytical tools

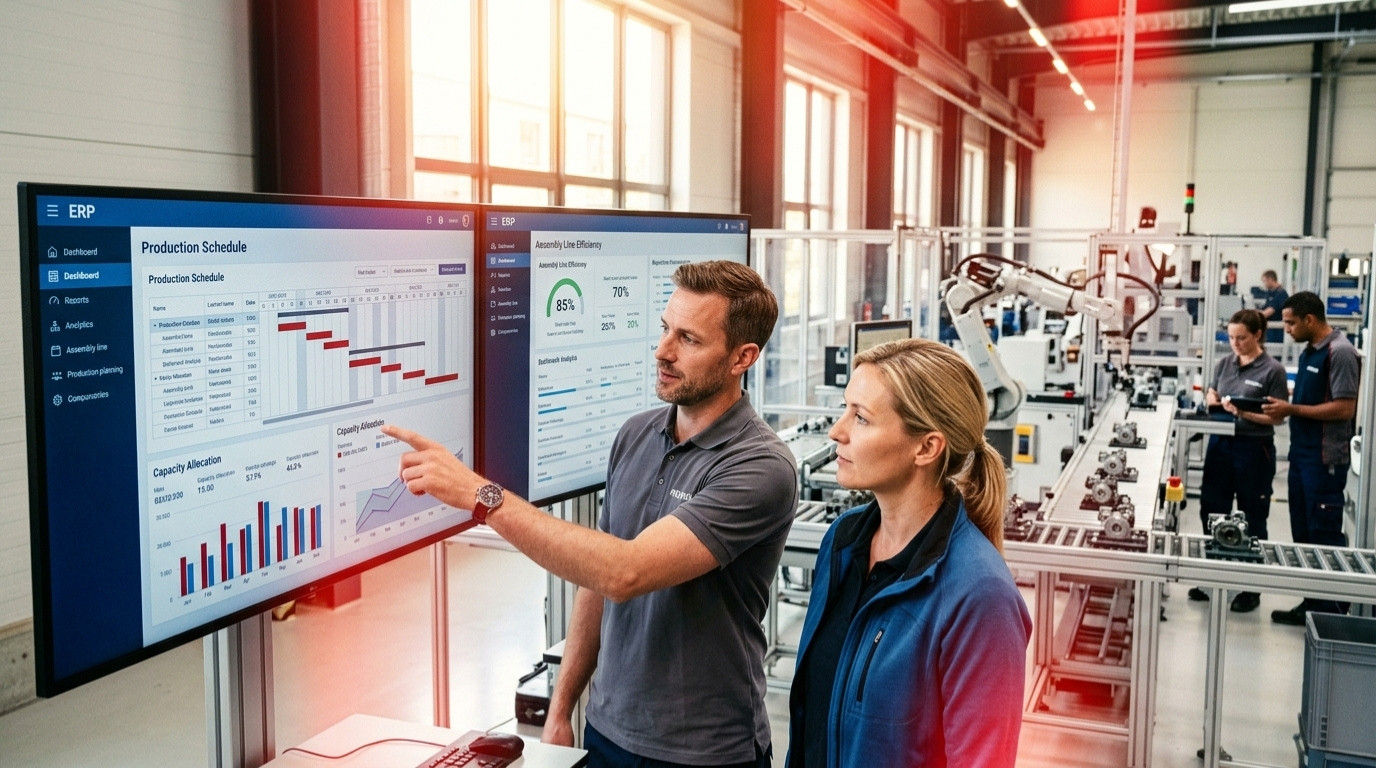
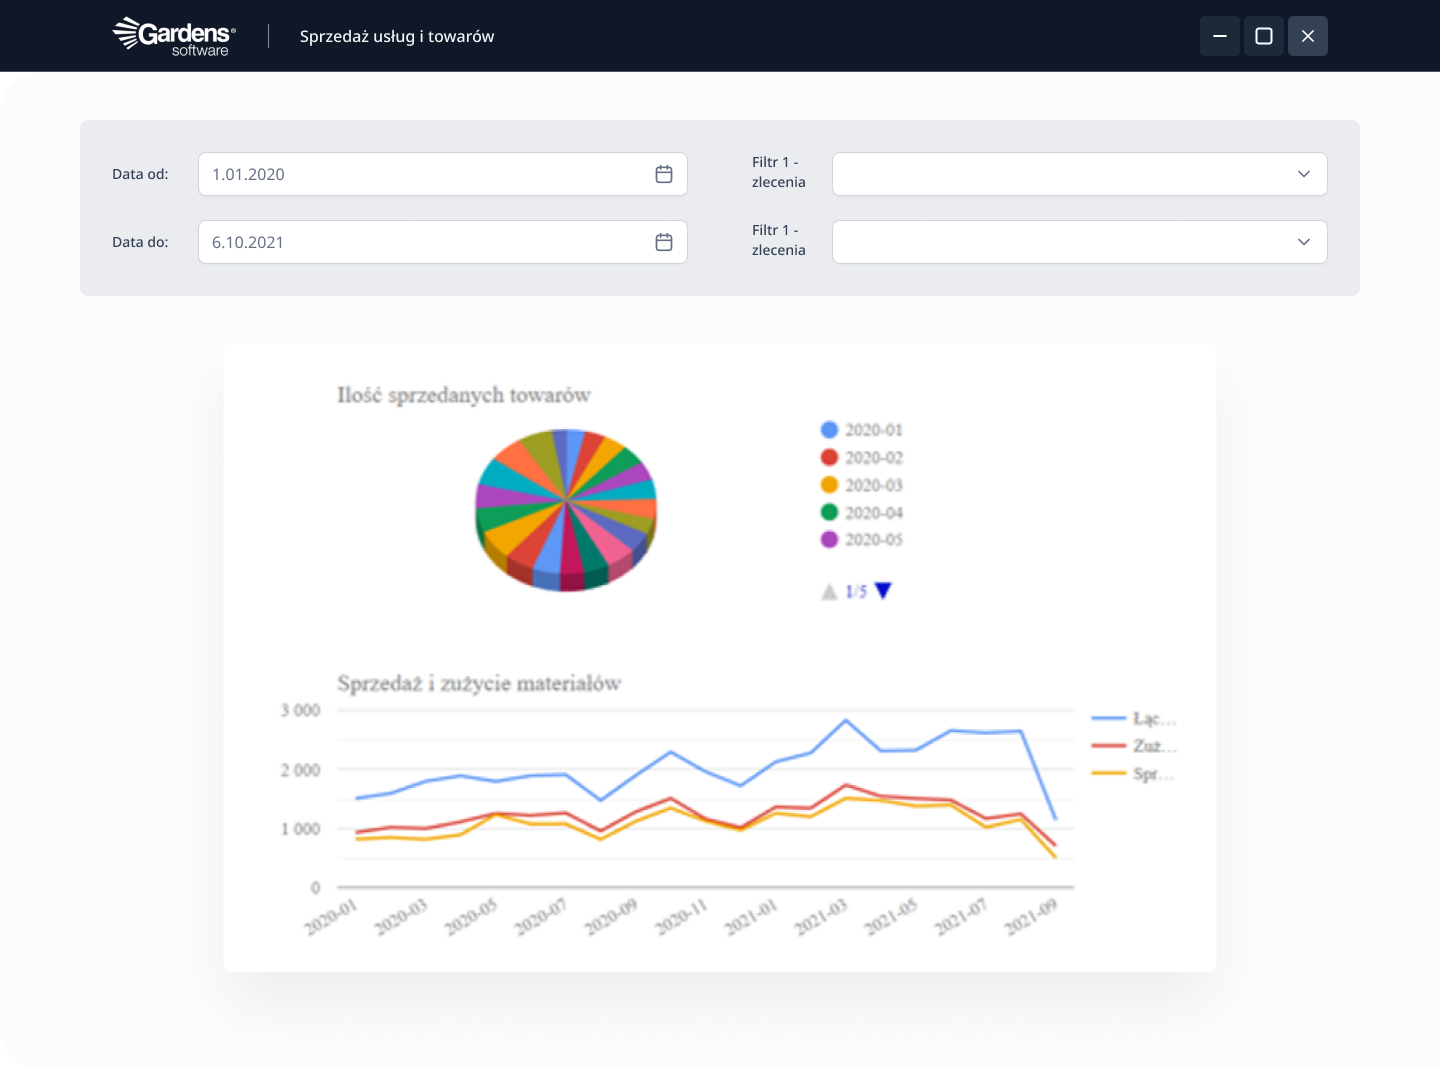
Our ERP analytical tools allow data to be presented in the form of charts, and the user can independently select the type. Both bar and line charts allow several indicators to be compared on one image. Such charts not only provide important information but are also an element of the presentations used during training.

The user can independently filter information by date or range, regarding goods or orders. The system allows you to select a few from among several filters, which creates interesting data views. What is important, the reports are directly linked to the source information. Just a few clicks to go to the data and check what the chart actually looks like. This is especially necessary in the event of suspected loss – the system makes it easier to find the weak point of the company.

Access to all company documents

The system not only collects and analyzes data on the company's operations and results, but also allows for uploading scans of original documents. This is a way to collect all agreements in one place, which is useful in the event of any disputes or a desire to re-verify the provisions contained in them. Moreover, the program also informs about the expiration dates of cooperation with contractors and the employment of individual employees.

It is also possible to leave comments in the ERP software, which allow for current implementation of changes in realized tasks. This is especially important when selecting contractors or suppliers. Cooperation with each company can also be evaluated in terms of timeliness, in order to avoid unnecessary downtime and problems during cooperation.

Business Intelligence Analysis System tailored to needs

We offer ERP systems in a standard version and one adapted to the characteristics of a specific enterprise's operations. This expanded software is ideal for companies that conduct non-typical activities or want to connect several systems into one. We select functions according to the needs of the enterprise, and in subsequent years, we can introduce additional modules. This is a way to ideally match the software to specific company needs and even better management of the organization.

If you are interested in creating an ERP system adapted to the characteristics of your company's operations, please contact us. We will discuss all available functions and specifics of the enterprise's operations. We will create a system that will allow for handling all company operations and effective collection of dispersed data.

Other modules

Ready for a new level of company management?

Fill out the form to see:

  • How our customized ERP system and integrated IDE environment works
  • How you can better, faster, and cheaper adapt the system to your needs
  • How we differ from standard ERP systems and boxed solutions
Don't wait, write to us!
We will contact you within 24h!
Zgoda*